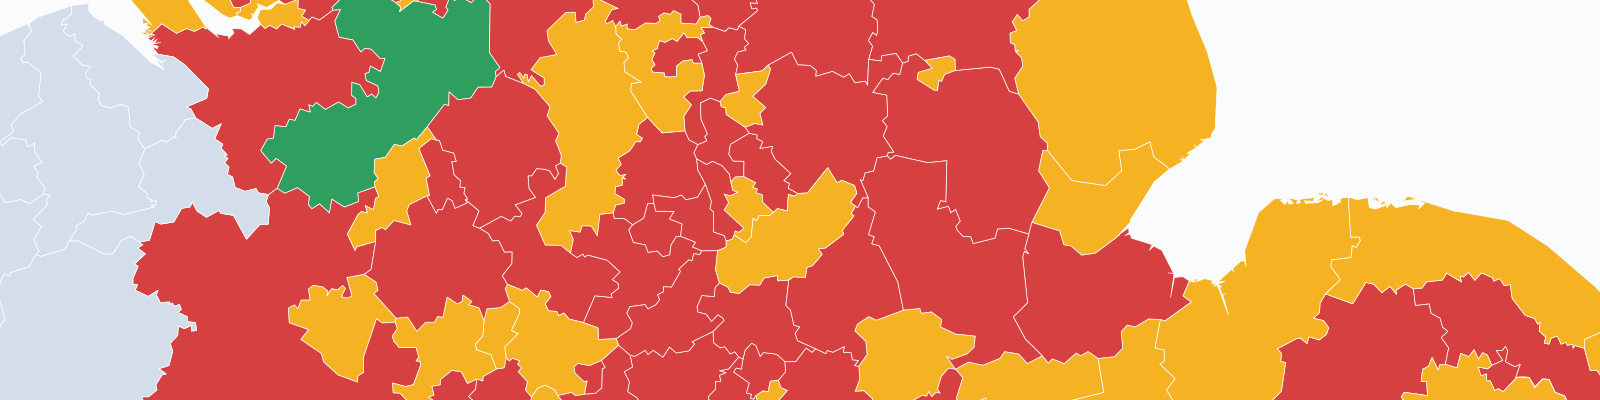
 296 local authorities
The overpayment map
Where businesses are most likely over-assessed, authority by authority. Deeper colour means a larger share worth checking. Full ranked table and a free CSV.
Open the mapWe analyse every rateable property in England against its comparablesA similar nearby property used as evidence for what your Rateable Value should be. Good comparables share your property's type, size band and location., then publish what we find. Free to read, free to quote, methodology in the open.
296 local authoritiesWhere businesses are most likely over-assessed, authority by authority. Deeper colour means a larger share worth checking. Full ranked table and a free CSV.
Open the mapRateable values the VOA altered, by sector and by authority, plus how many Checks and Challenges are being filed where. Before and after, for the properties the VOA amended each month.
See this month’s dataEvery formal case that has altered the 2026 rating list, property by property, with the floor area and rateable value before and after. A Check corrects the facts; a Challenge argues the valuation.
Open the registersHow the revaluation actually moved rateable values — the median of the individual property changes, matched to each assessment’s own entry on the 2023 list, by sector and by authority.
See the analysisThe same engine, run on your address. Free, no obligation.